Robot Window (Developer)
Robot developer window.
Overview
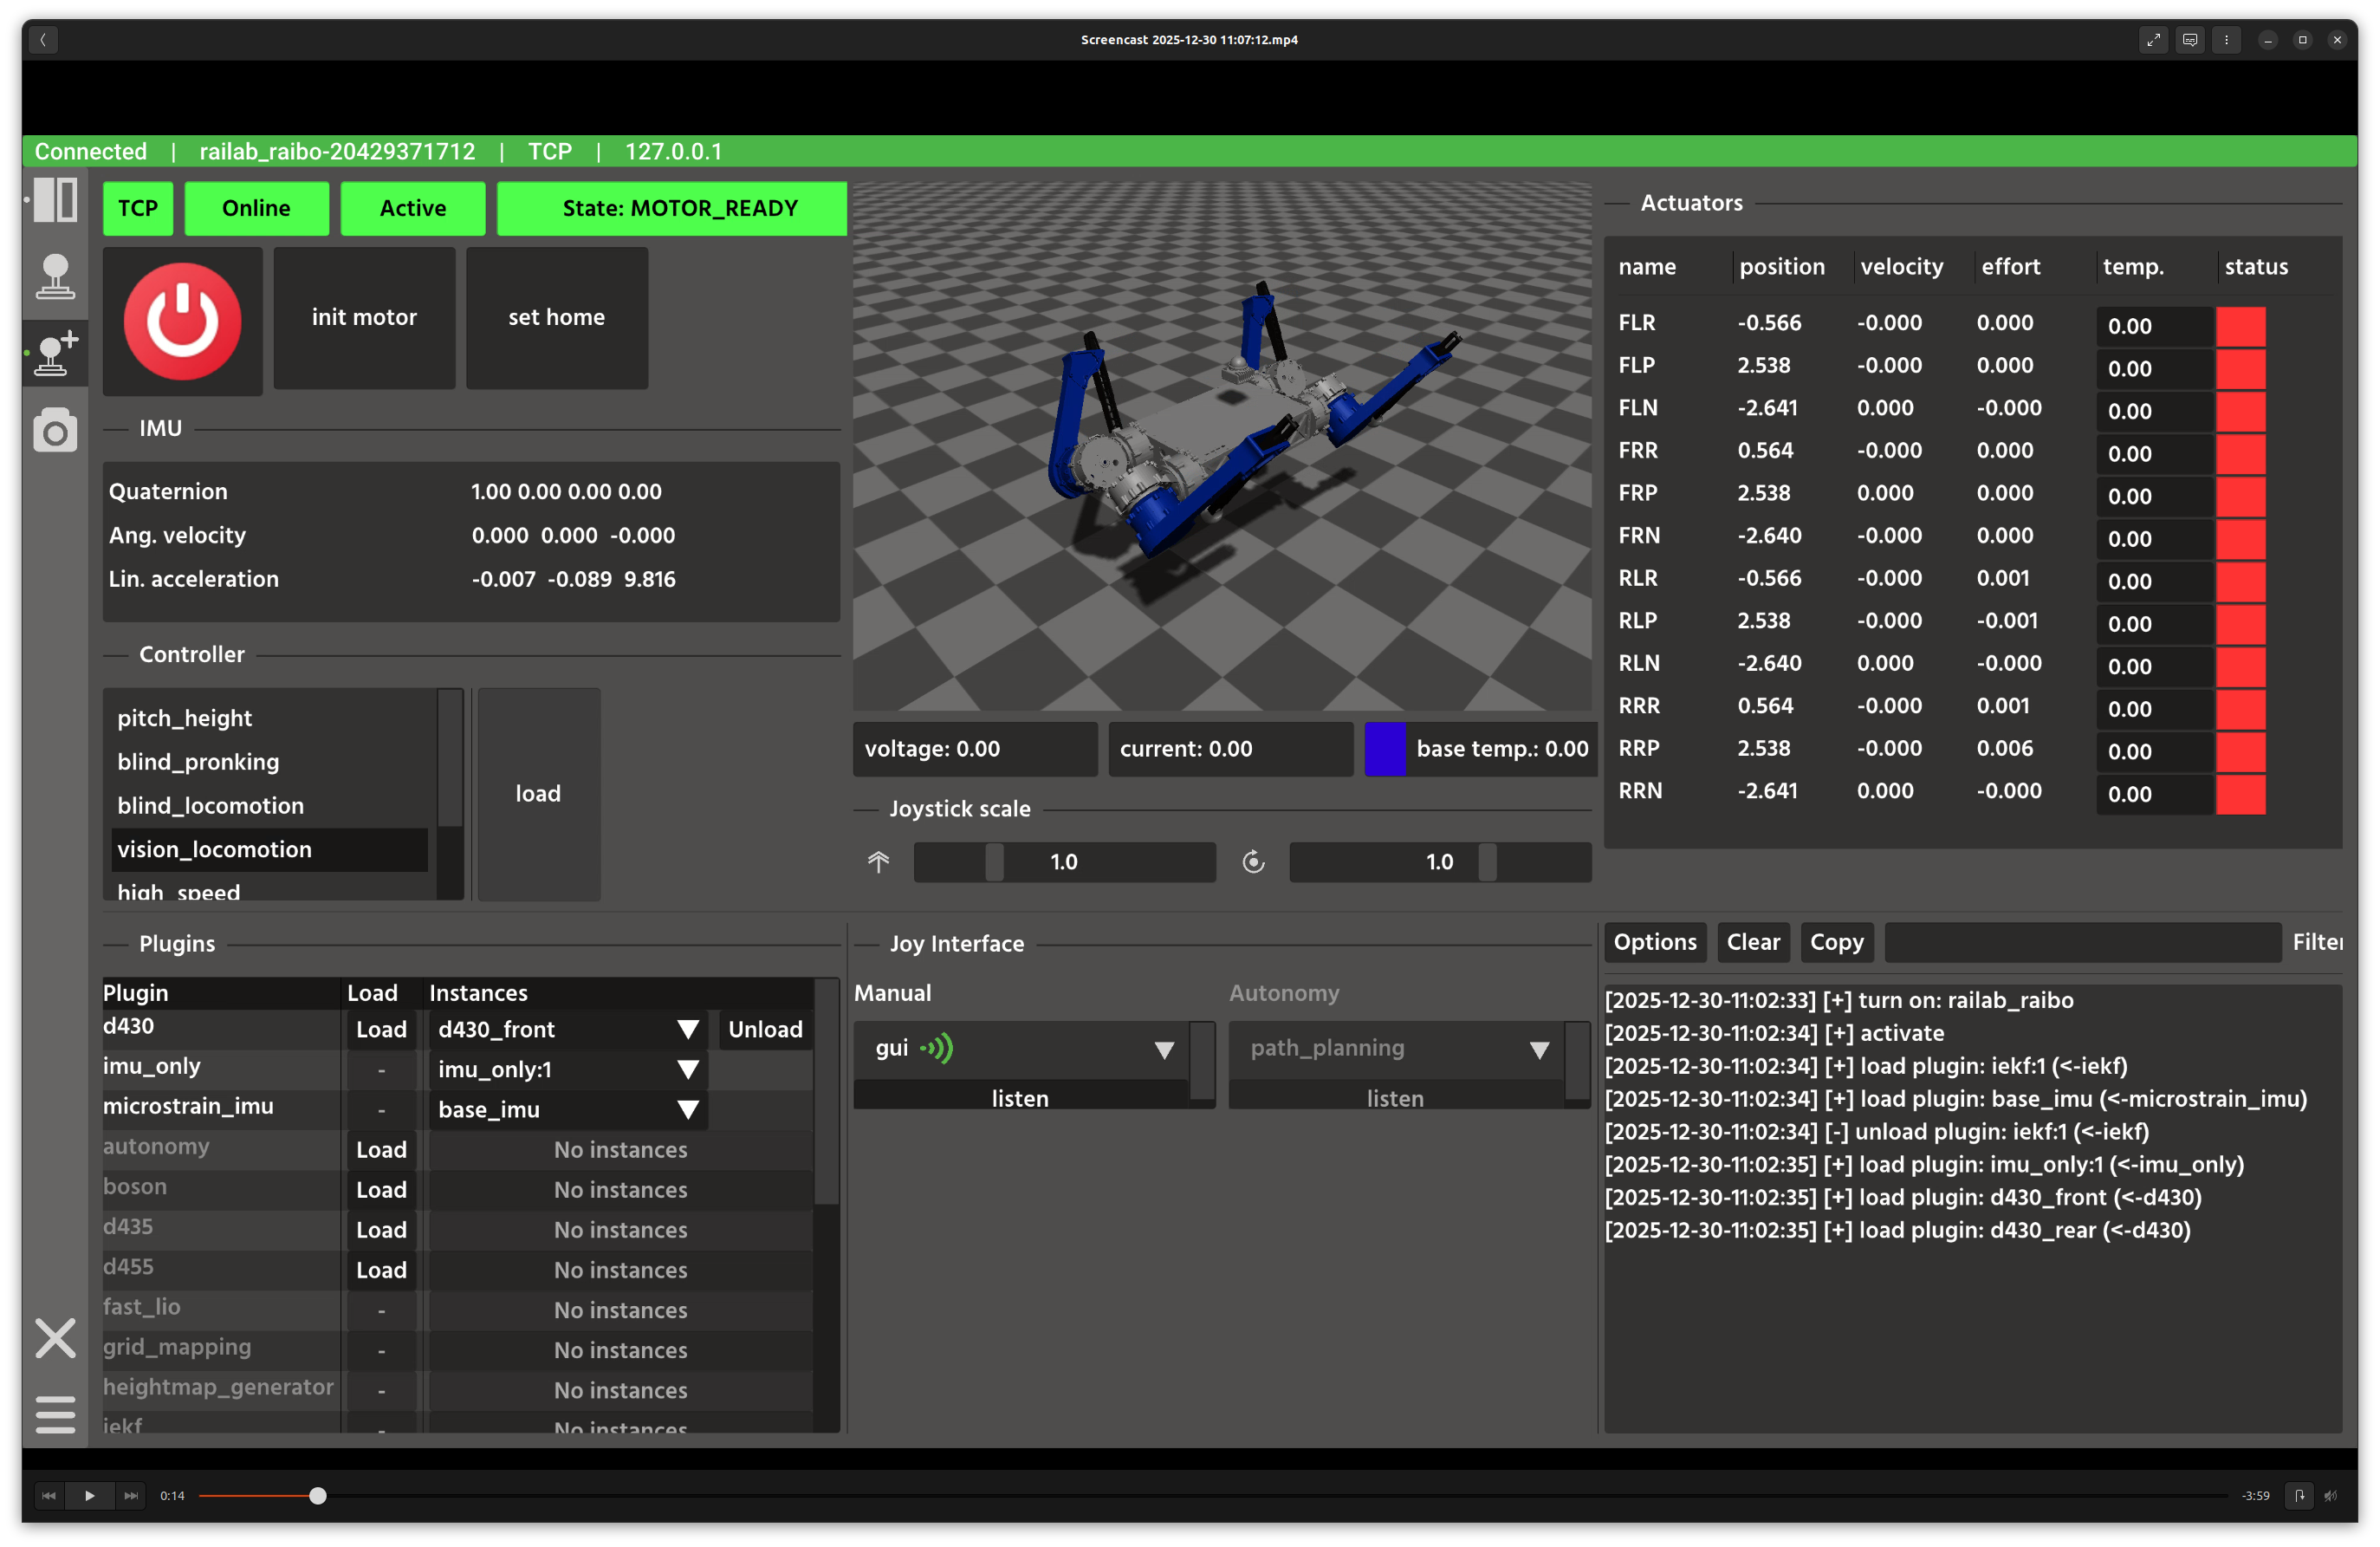
In the screenshot above, the top row is split into three columns: controls and IMU on the left, 3D visualization in the center, and actuator/joystick widgets on the right. The bottom row contains plugin management, joystick routing, and a live log console.
Layout
Left column: connection indicators, power/motor actions, home selection, stand/sit controls, IMU readout, and controller selection.
Center column: Rayrai visualization with voltage/current/temperature bars.
Right column: actuator table (position, velocity, effort, temperature, status) and joystick scaling sliders.
Bottom row: plugin list with load/unload, joystick interface routing, and log output.
Controls and Indicators
Connection indicators show transport type (TCP/WEB), online state, and robot state.
Home selection prompts for
mainorportablehome before callingset_home_with_type.Controller list highlights the currently loaded controller and provides a load button.
Plugin table shows instance lists and load/unload actions.
Joy interface lets you switch between manual and autonomy sources and send the
set_listencommand.
Data Sources and Services
robot_state,module_list, andjoy_rangefeed telemetry and UI state.gui_messagepopulates the log console.describe_robotprovides software version and metadata.Control services include
turn_on,turn_off,init_motor,stop_motor,stand_up,sit_down,joint_test,load_controller, andload_plugin.
Notes
The developer window uses the same safety checks as the operator window but exposes more raw controls and plugin state.
Use the plugin table to manage multiple instances and unload unused plugins to reduce compute load.