Profile Timeline Window
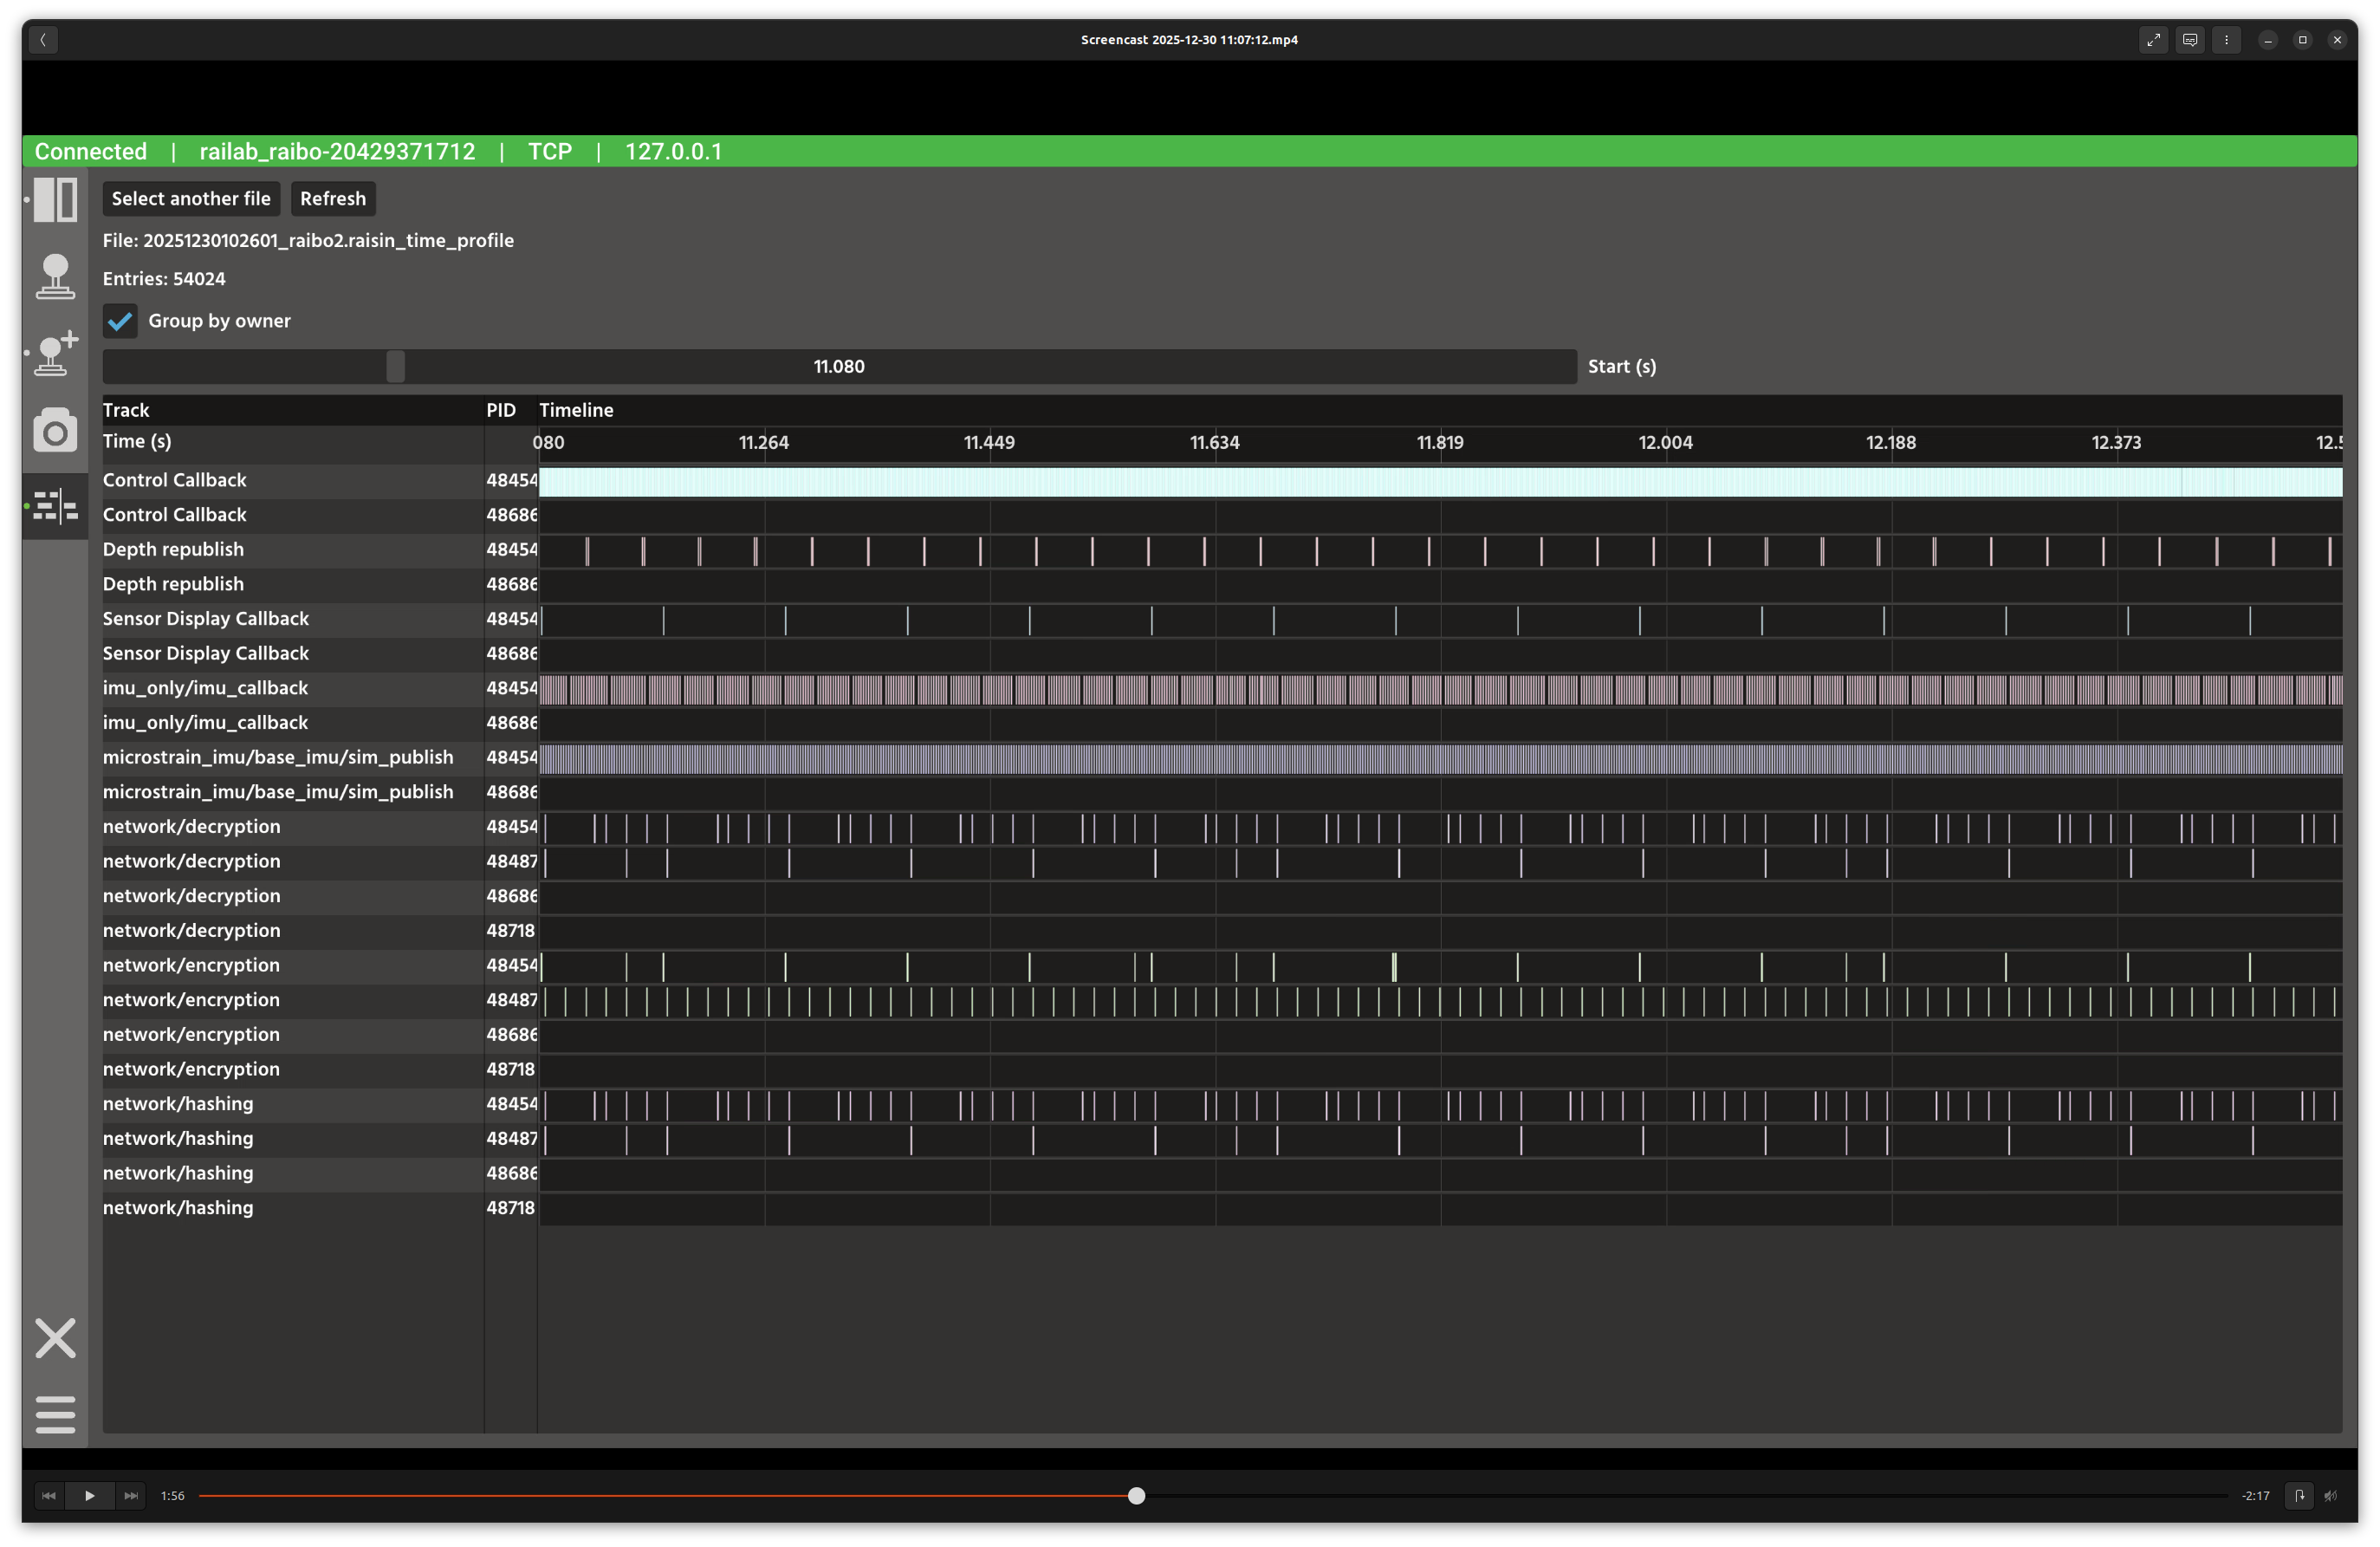
Profile timeline window.
Overview
In the screenshot above, the left column lists recorded time profile files, and the right panel shows a scrollable timeline of execution spans. Each row represents a function (optionally grouped by owner) and uses color to distinguish tracks.
Layout
File list:
.raisin_time_profilelogs fromraisin_time_profile.File summary: selected file name and entry count.
Timeline controls: start position slider and grouping toggle.
Timeline table: track labels, PIDs, and execution bars.
Controls and Indicators
Group by owner toggles whether tracks are grouped by function owner.
Start (s) scrolls the visible time window.
Drag or select within the timeline to inspect specific entries.
Data Sources
Reads profile logs from
raisin_time_profiledirectories on disk.
Notes
Use the start slider to zoom into dense time ranges.
When grouping is enabled, tracks are labeled as
function [owner]to make multi-process activity clearer.