Node Flow Window
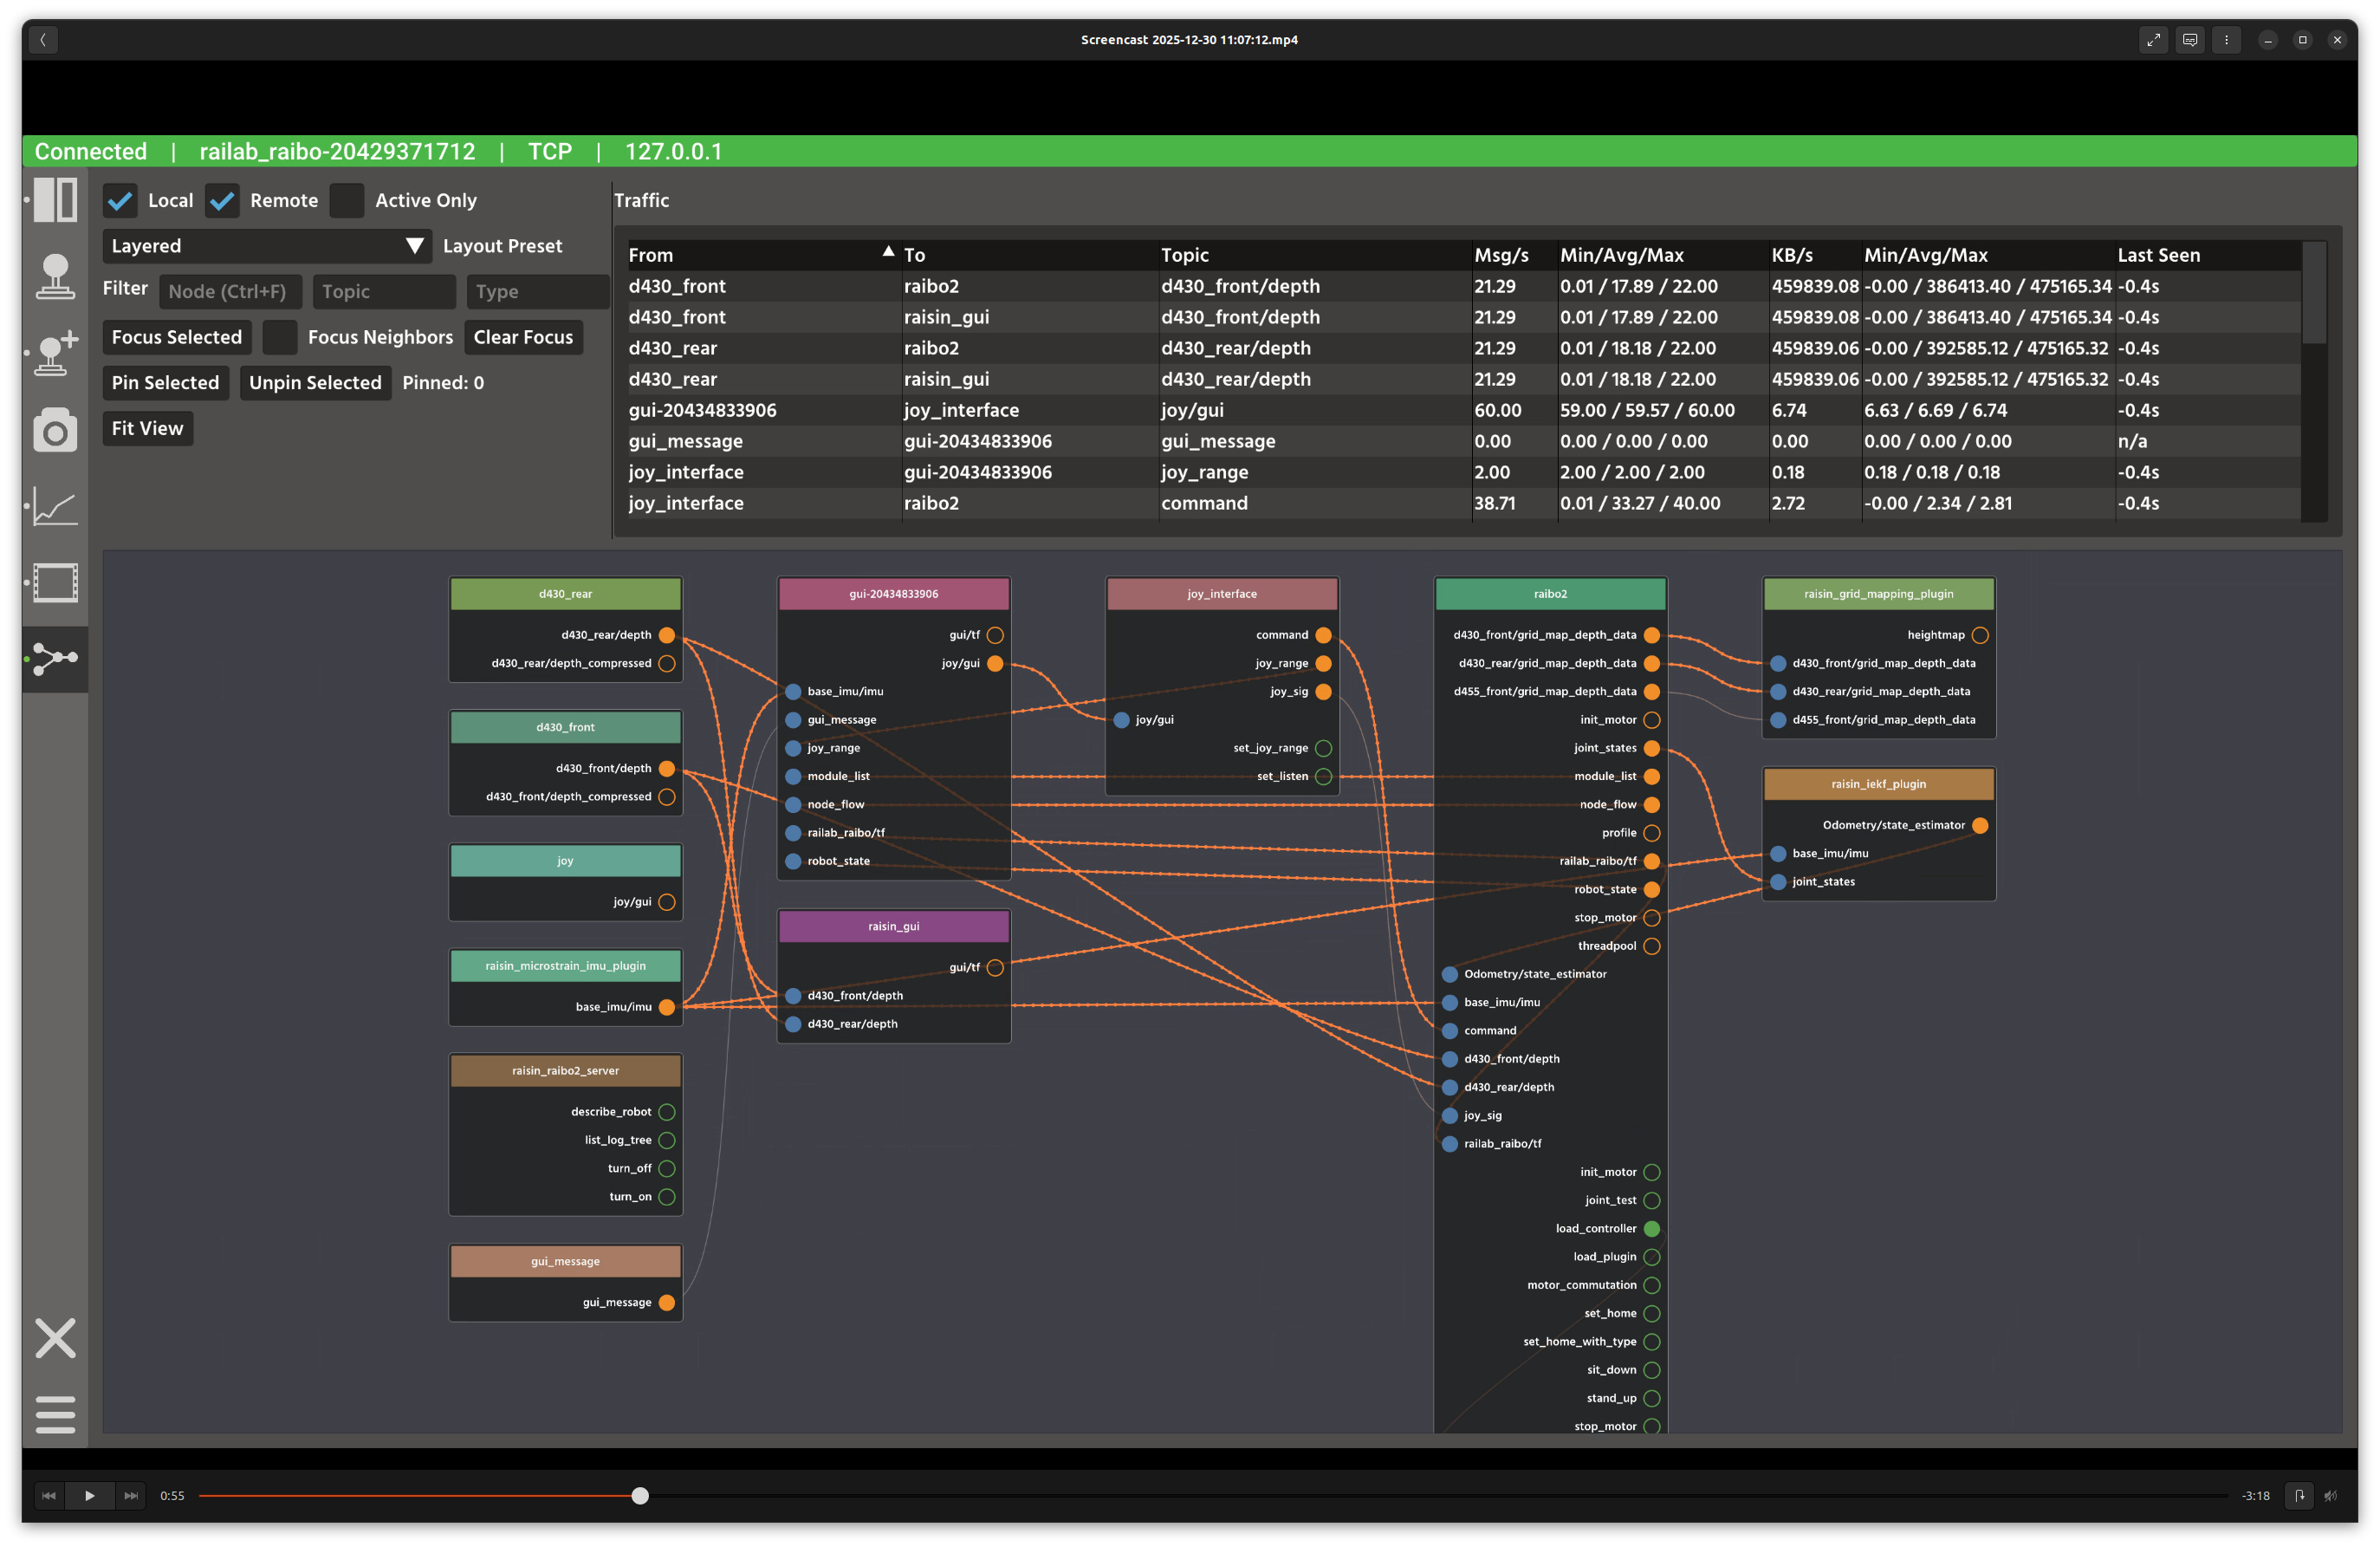
Node Flow window.
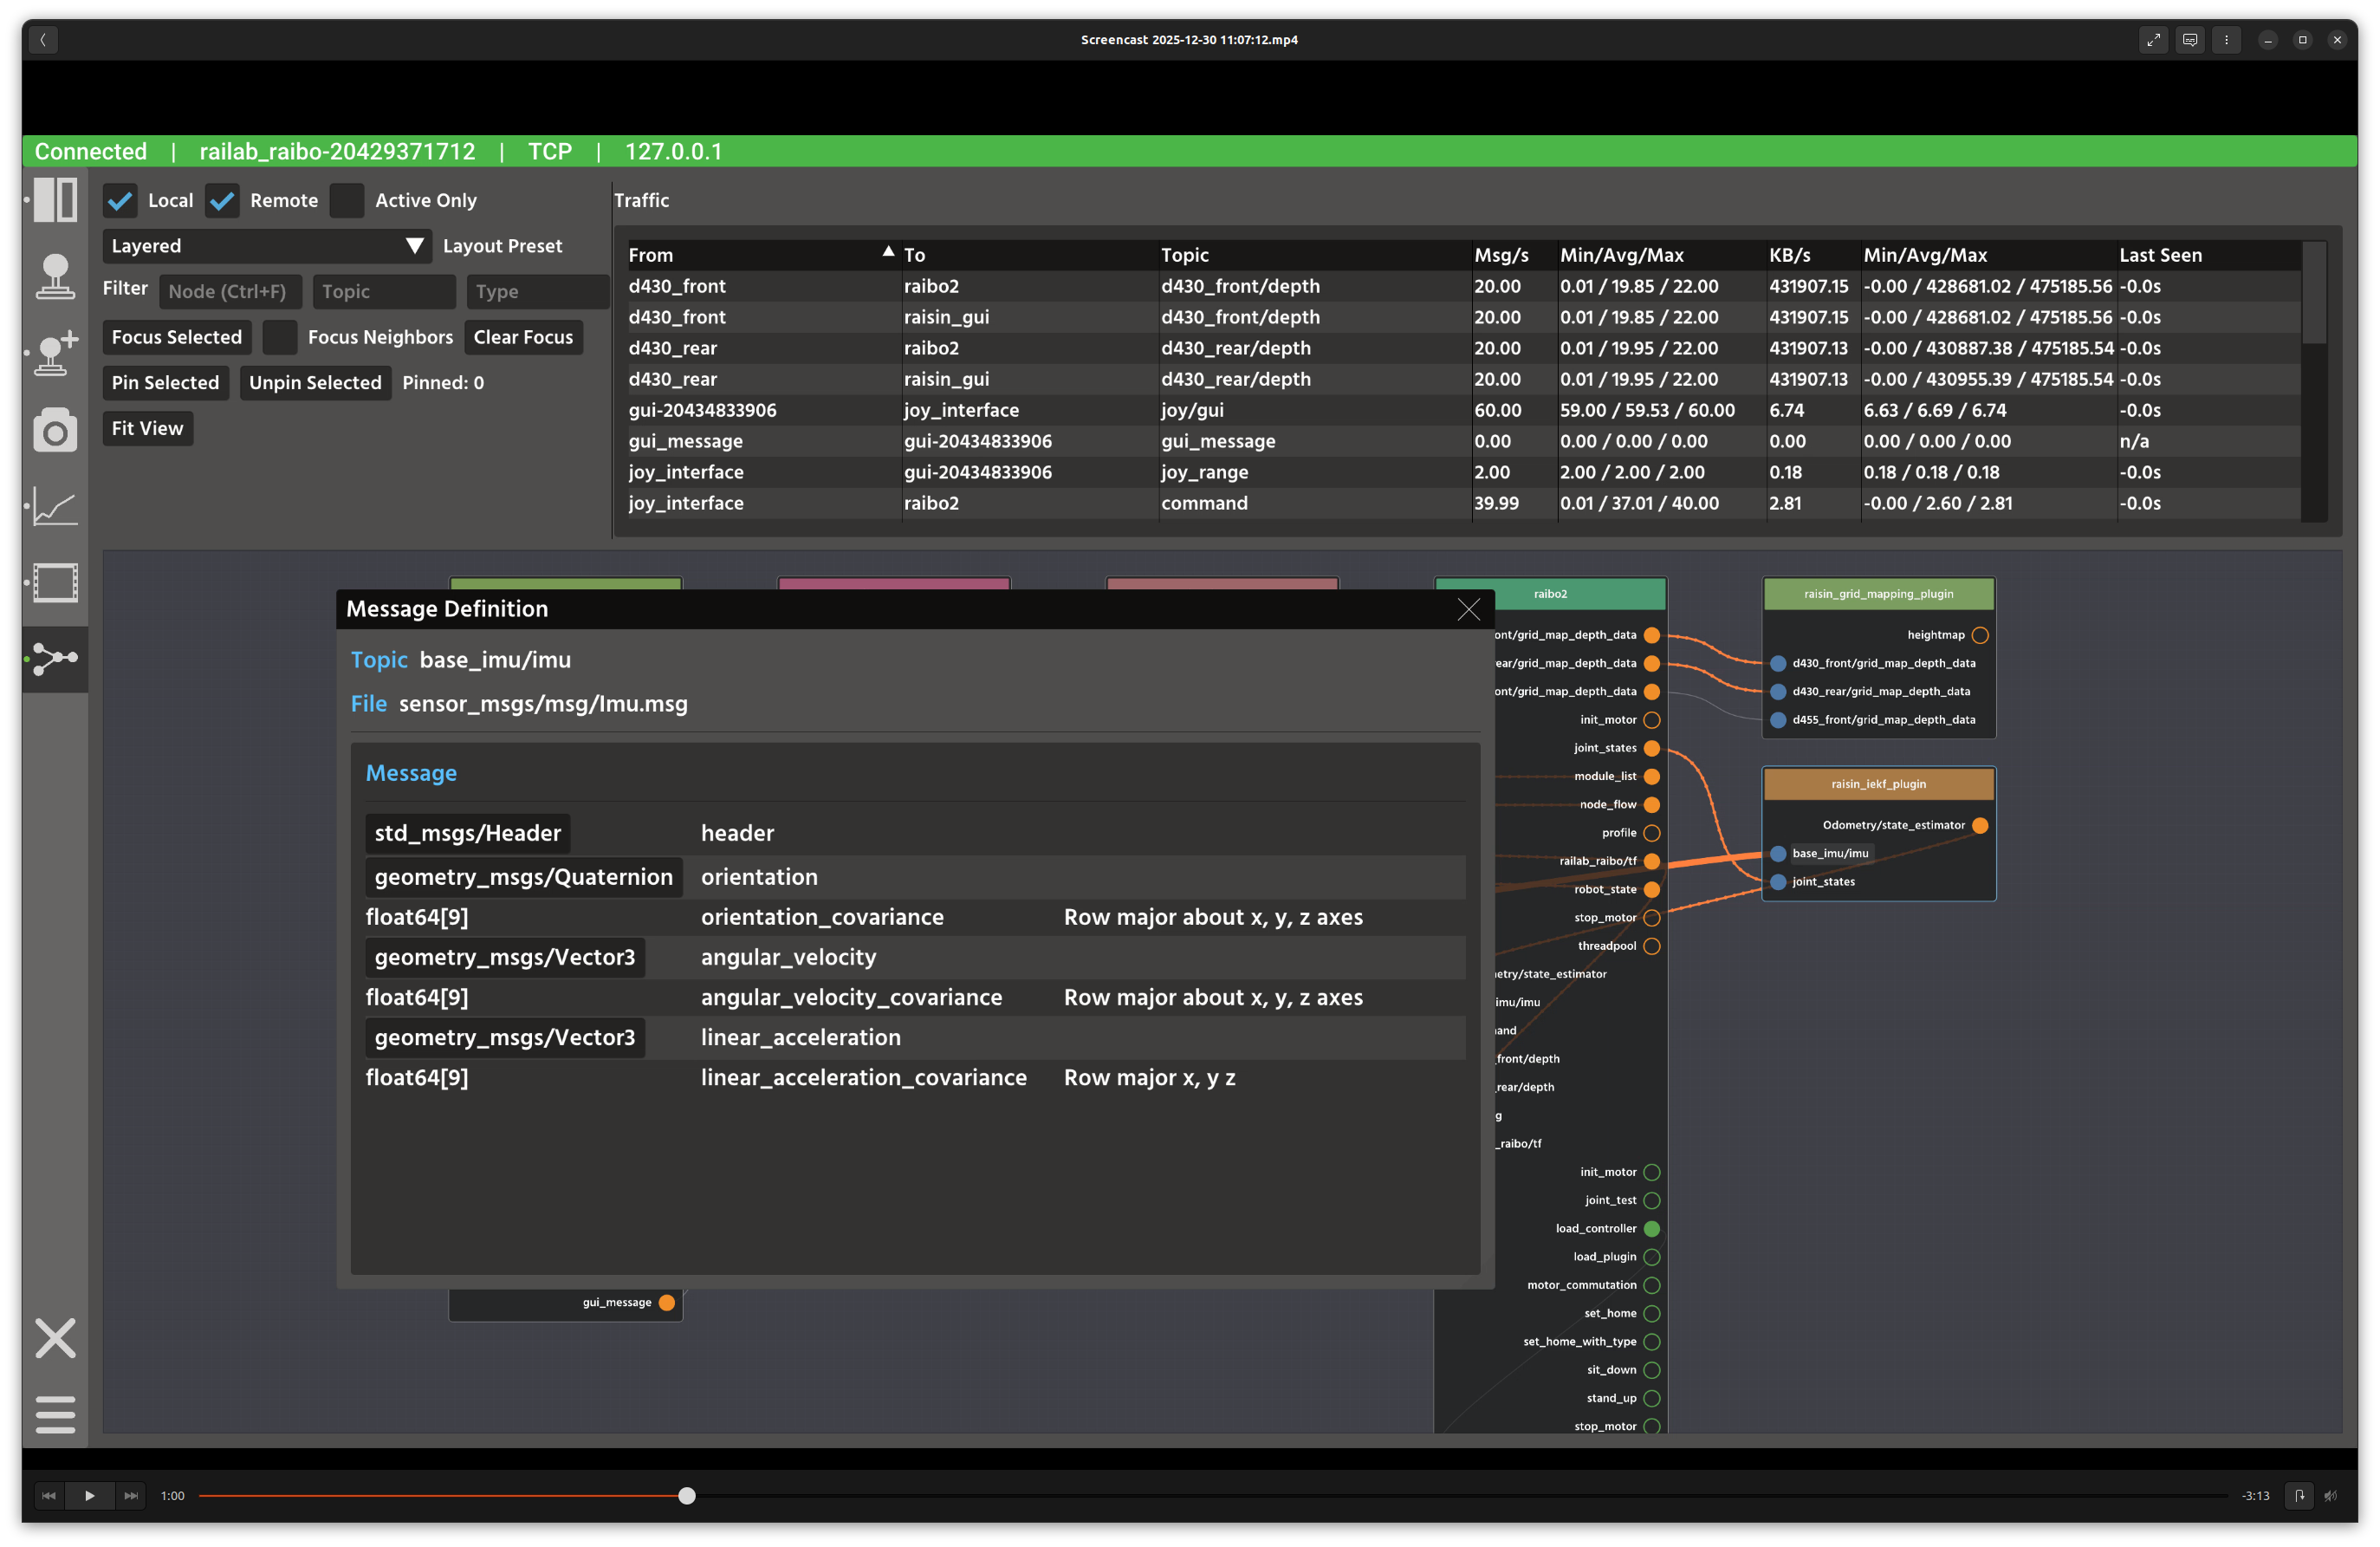
Message description pop-up.
Overview
In the screenshot above, the top bar contains filters and traffic metrics, while the main area renders an interactive node graph of publish/subscribe and service flows. Hovering pins and links reveals detailed rate and type information.
Layout
Controls panel: local/remote toggles, layout presets, filter fields, and focus/pin actions.
Traffic panel: sortable table of message rates and byte rates for visible flows.
Node graph: visualizes nodes, publishers, subscribers, clients, and services with directional links.
Controls and Indicators
Local / Remote / Active Only filters which flows are displayed.
Layout preset chooses layered or radial layouts; manual mode disables auto-layout.
Filter fields match nodes, topics, or message types.
Pin Selected locks nodes in place; Fit View re-centers the graph.
Data Sources
Flow data is subscribed from
node_flow(raisin_interfaces::msg::NodeFlow).Message sizes and rates are derived from connection traffic statistics.
Notes
Use the traffic table to identify high-bandwidth topics before optimizing your pipeline.
Pin critical nodes when using auto-layout to keep important layouts stable.