Threadpool Window
Threadpool window.
Overview
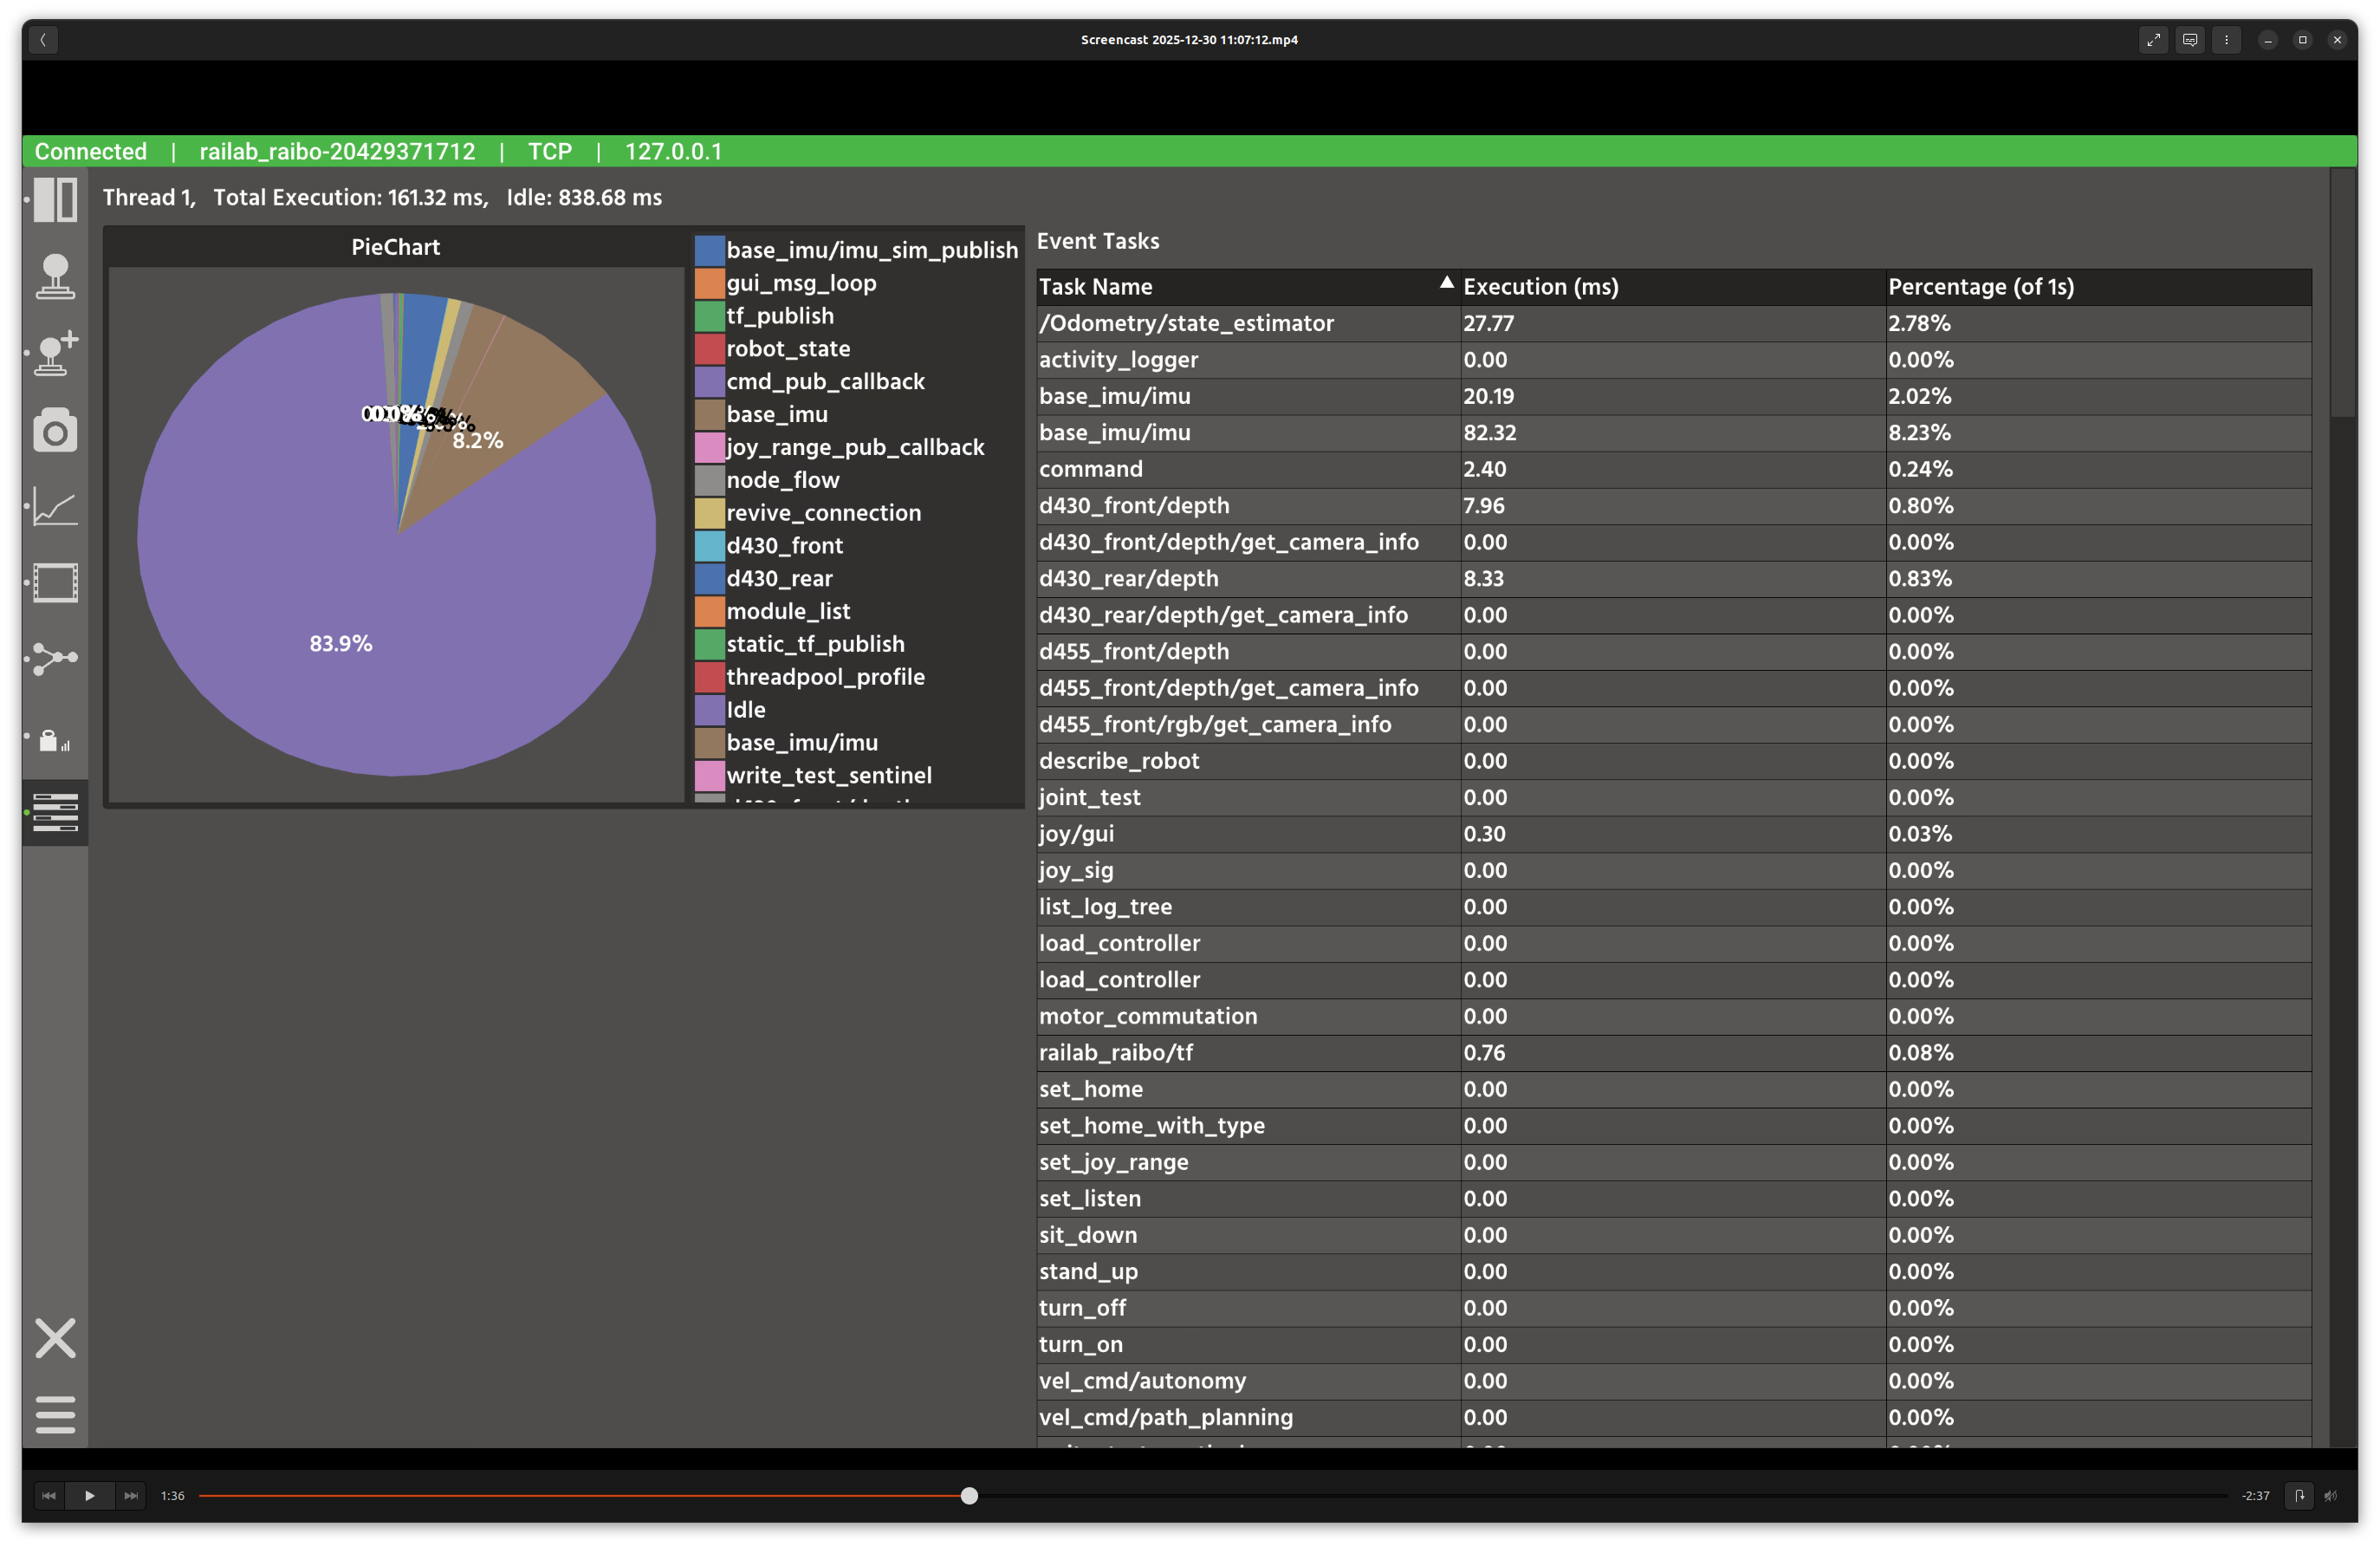
In the screenshot above, each thread is shown with a pie chart summary and a breakdown table of periodic and event tasks. The view helps diagnose scheduler load and idle time.
Layout
Per-thread sections: each thread shows a pie chart of execution time.
Task tables: periodic and event task breakdowns with execution stats.
Idle time: computed as the remainder of a 1-second budget.
Controls and Indicators
Pie chart slices correspond to task names and idle time.
Tables show execution counts and average delays for periodic tasks.
Data Sources
Subscribes to
threadpool(raisin_interfaces::msg::ThreadPoolProfile) from the active connection.
Notes
High idle time indicates available compute; sustained near-100% utilization suggests threadpool saturation.