Robot Selection Window
Robot Selection window.
Overview
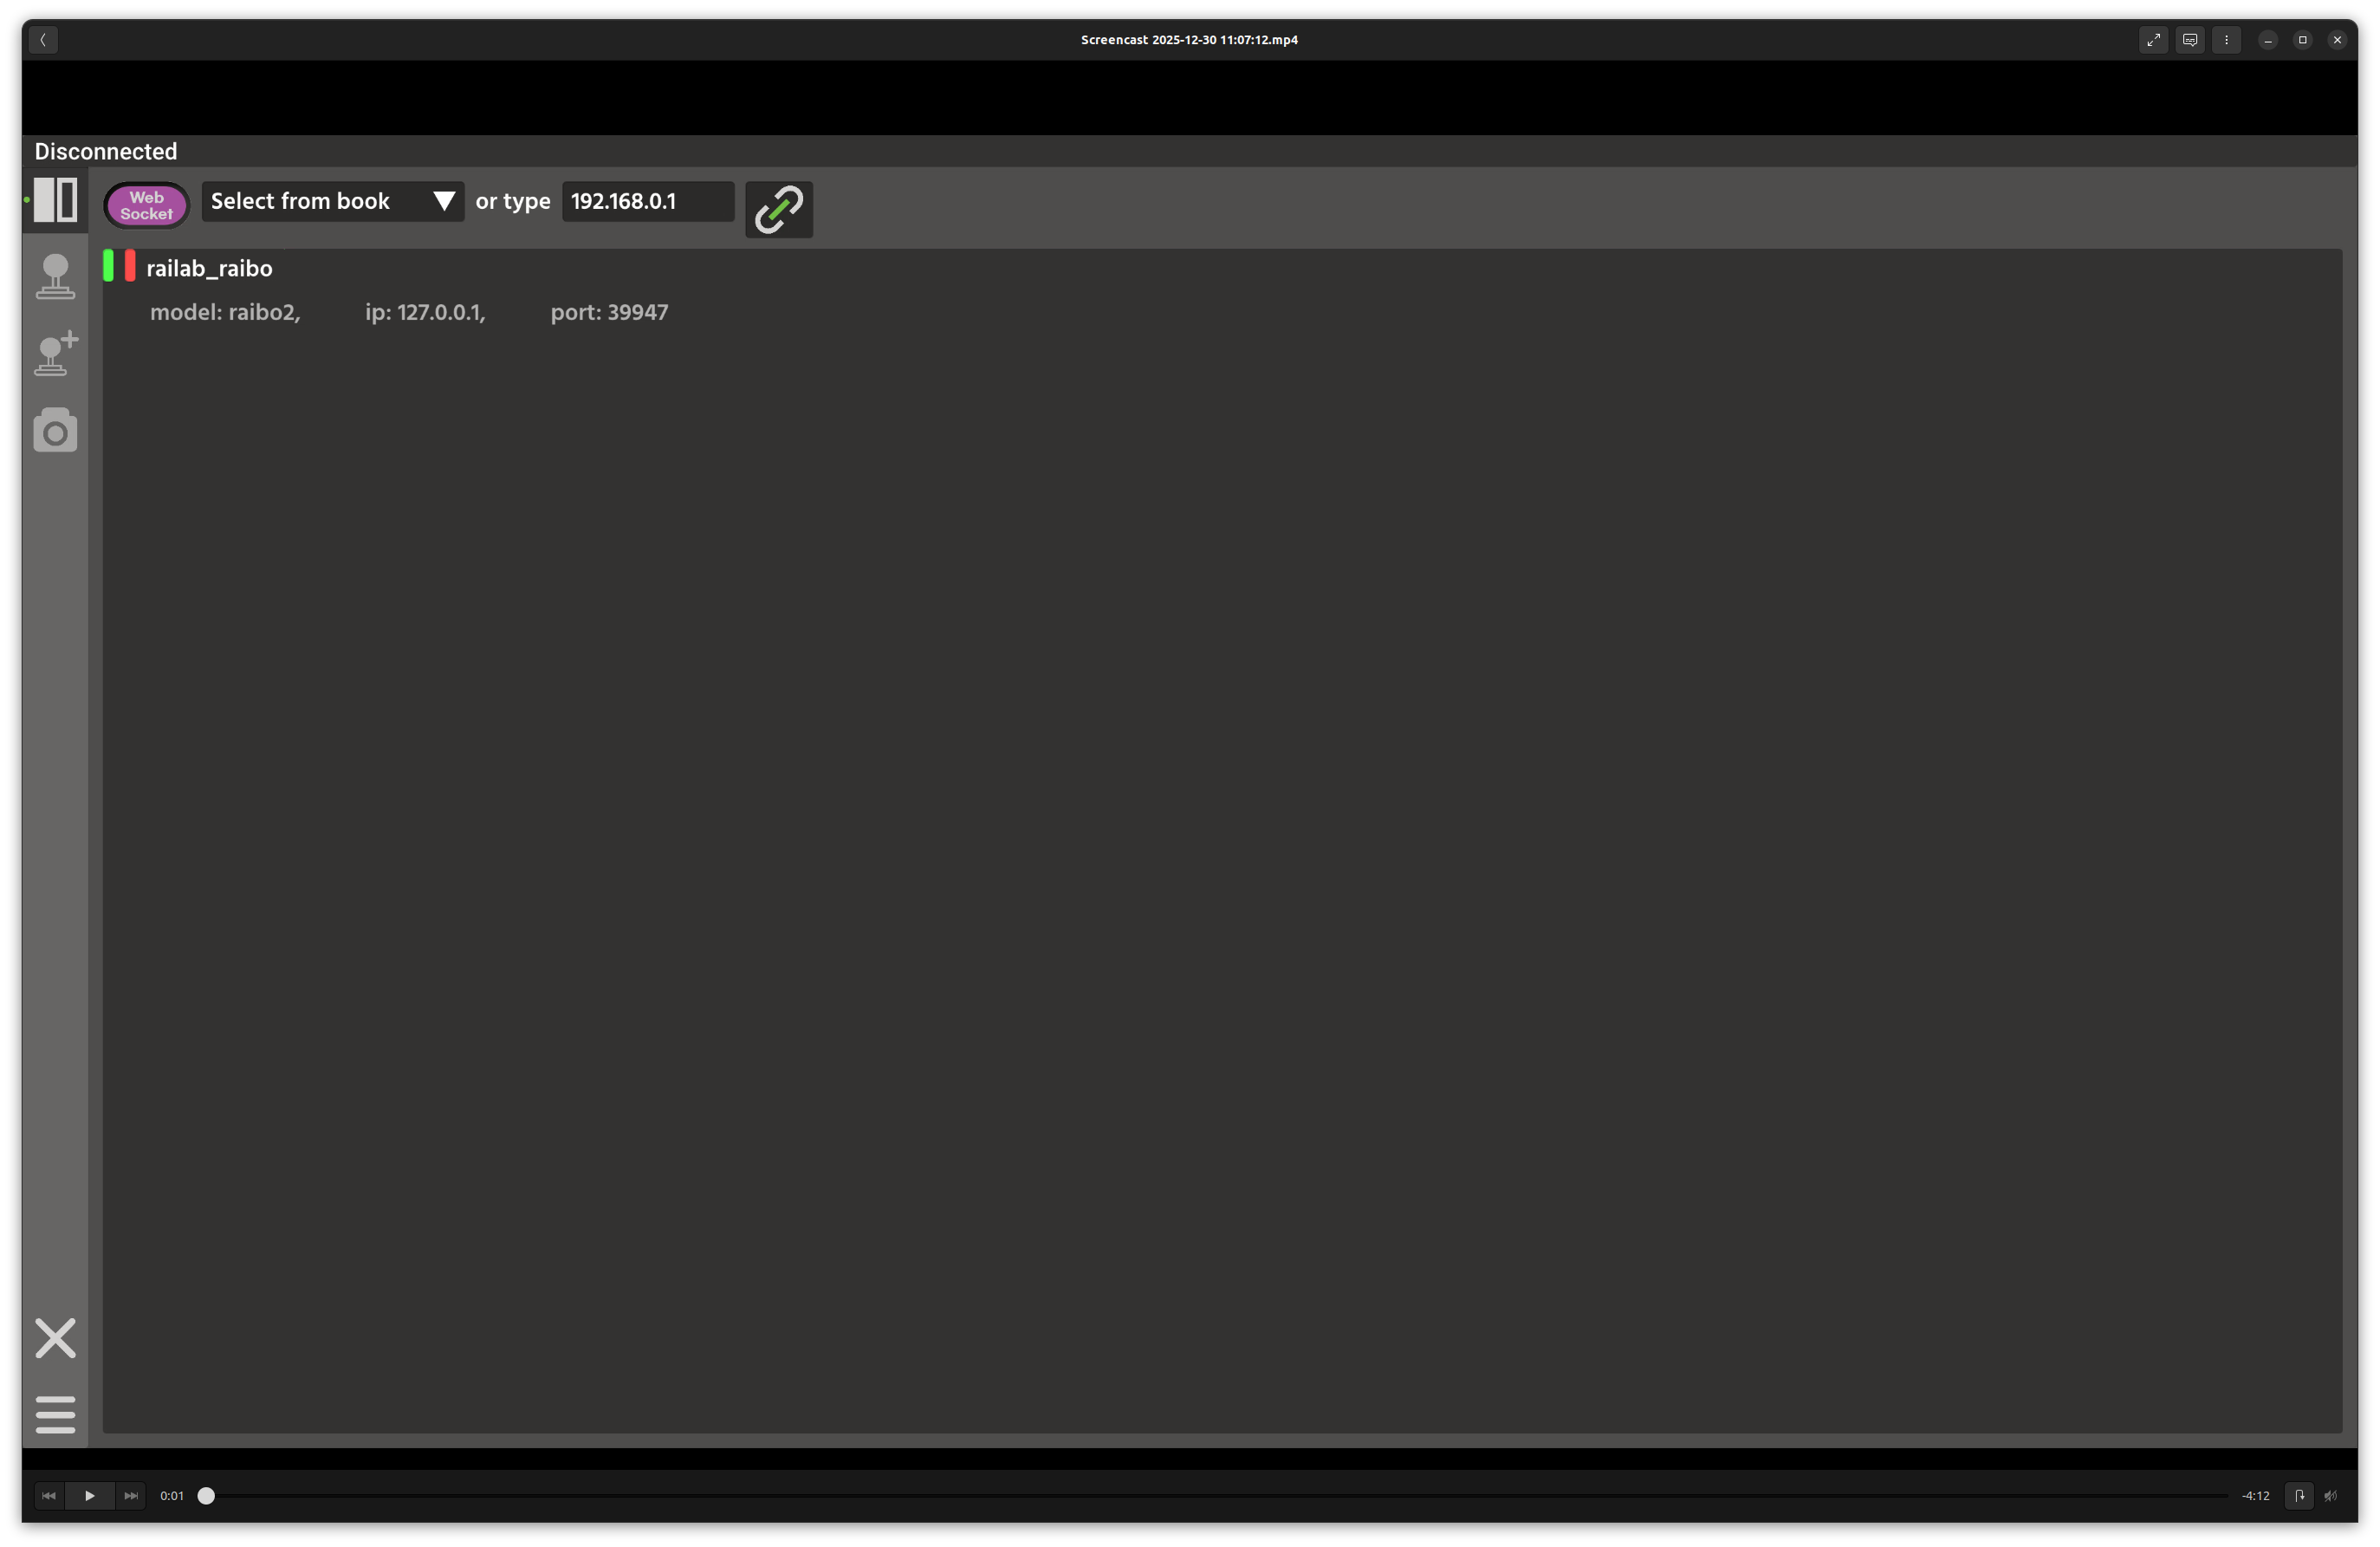
In the screenshot above, the top bar contains the connection controls, and the main panel lists discovered robots. Selecting a robot reveals connection actions, a short status summary, and optional diagnostics panes.
Layout
Top bar: IP address book dropdown, manual IP entry field, and the WebSocket connect button.
Device list: discovered robots with two status dots (heartbeat freshness and connection state), plus network type icons.
Action row (for the selected robot): operator, developer, and disconnect buttons (or a connect button for disconnected entries).
Details area: simulation vs real status, serial number, model, IP, and port, plus an optional description popup.
Diagnostics area: four columns listing publishers, services, clients, and subscribers. Selecting an entry shows traffic plots below.
Key Controls
WebSocket connect: connects to
<ip>:9002using the manual IP field.Operator / Developer: opens the
robotorrobot_devwindow for the selected robot.…: opens the Robot Description popup with model and power limits.
Data Sources and Services
Device discovery and connection status are derived from the Raisin network layer and heartbeat timing.
Robot metadata is fetched via the
describe_robotservice.Traffic plots use per-topic counters from the active connection.
Notes
If a robot advertises multiple IPs, a dropdown appears to select the active endpoint.
The diagnostics area reflects the currently selected connection; use it to verify topics before opening other windows.