Profile Window
Profile window.
Overview
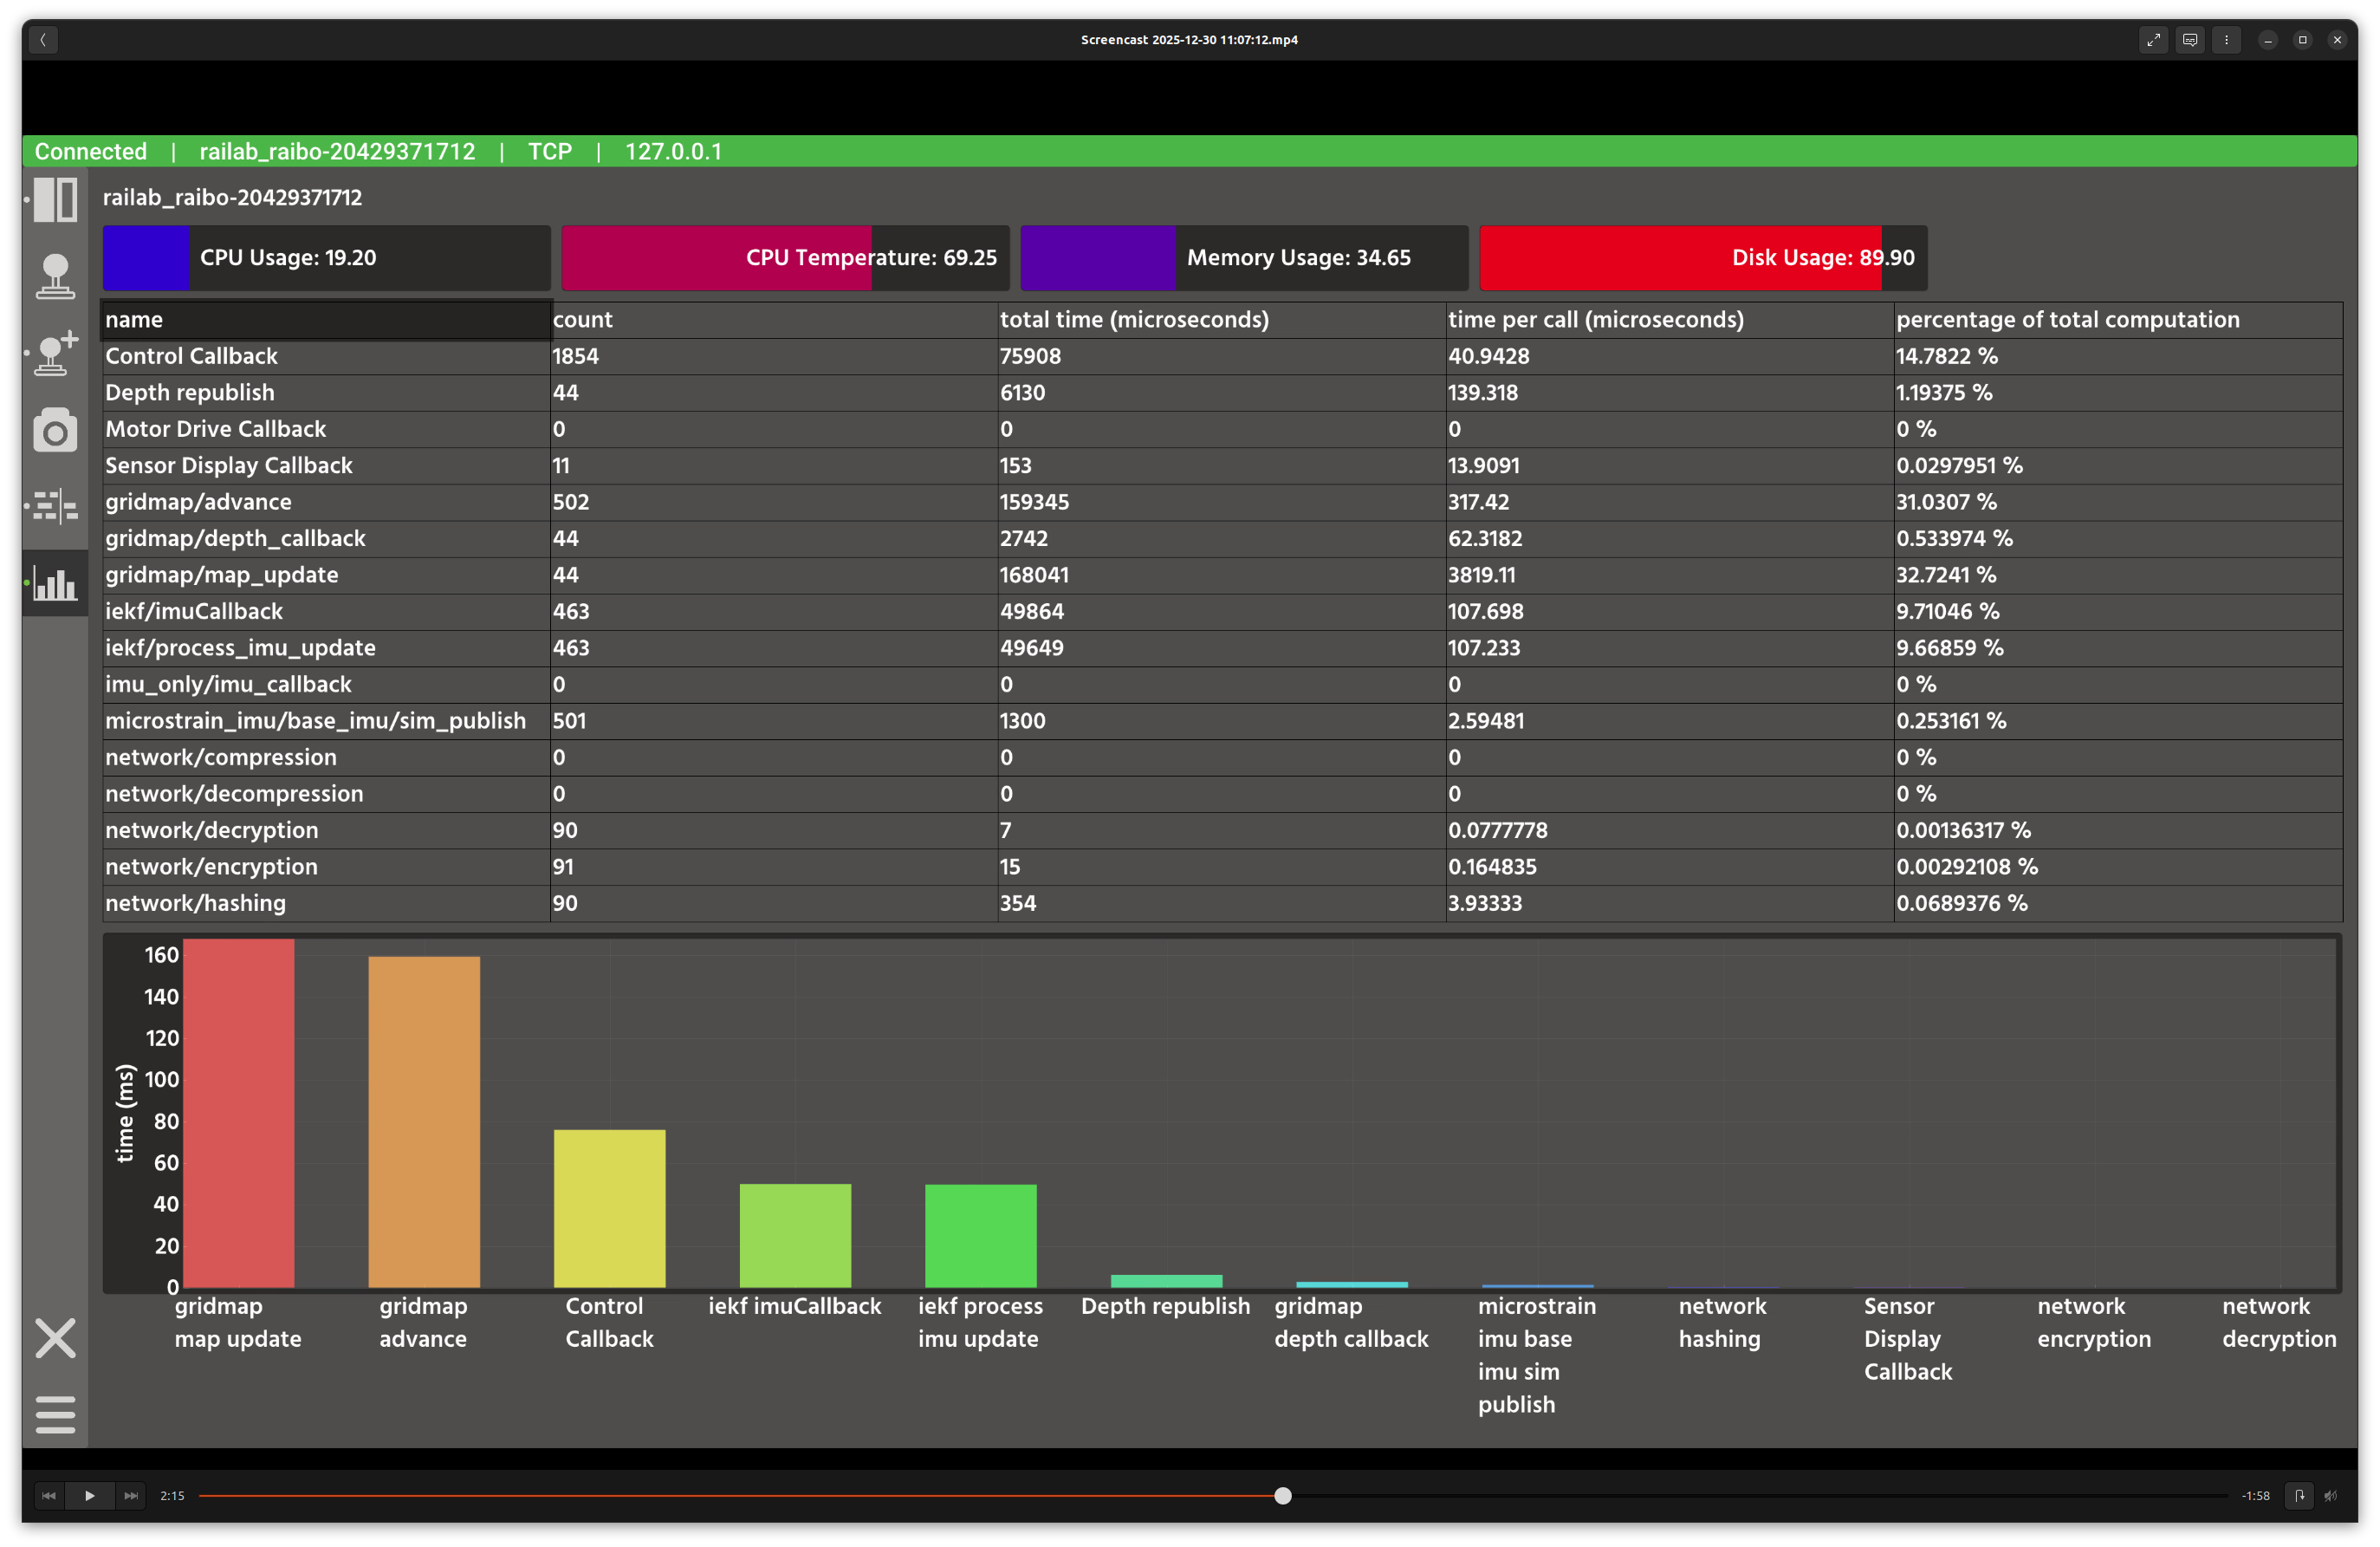
In the screenshot above, the top area shows live system indicators, while the main panel lists function-level timing statistics and a bar chart of the most expensive calls.
Layout
System indicators: CPU, temperature, memory, and disk usage gauges.
Timing table: sortable statistics for each profiled function.
Bar chart: top functions ranked by total time.
Controls and Indicators
Click table headers to sort by name, count, total time, per-call time, or percentage of total computation.
The bar chart labels are truncated in the plot; hover for full labels.
Data Sources
Subscribes to
profile(raisin_interfaces::msg::TimeProfile) from the active connection.
Notes
Sorting by total time is useful for identifying compute bottlenecks.
CPU temperature and memory usage reflect the robot system, not the GUI host.