Lock Profiler Window
Lock profiler window.
Overview
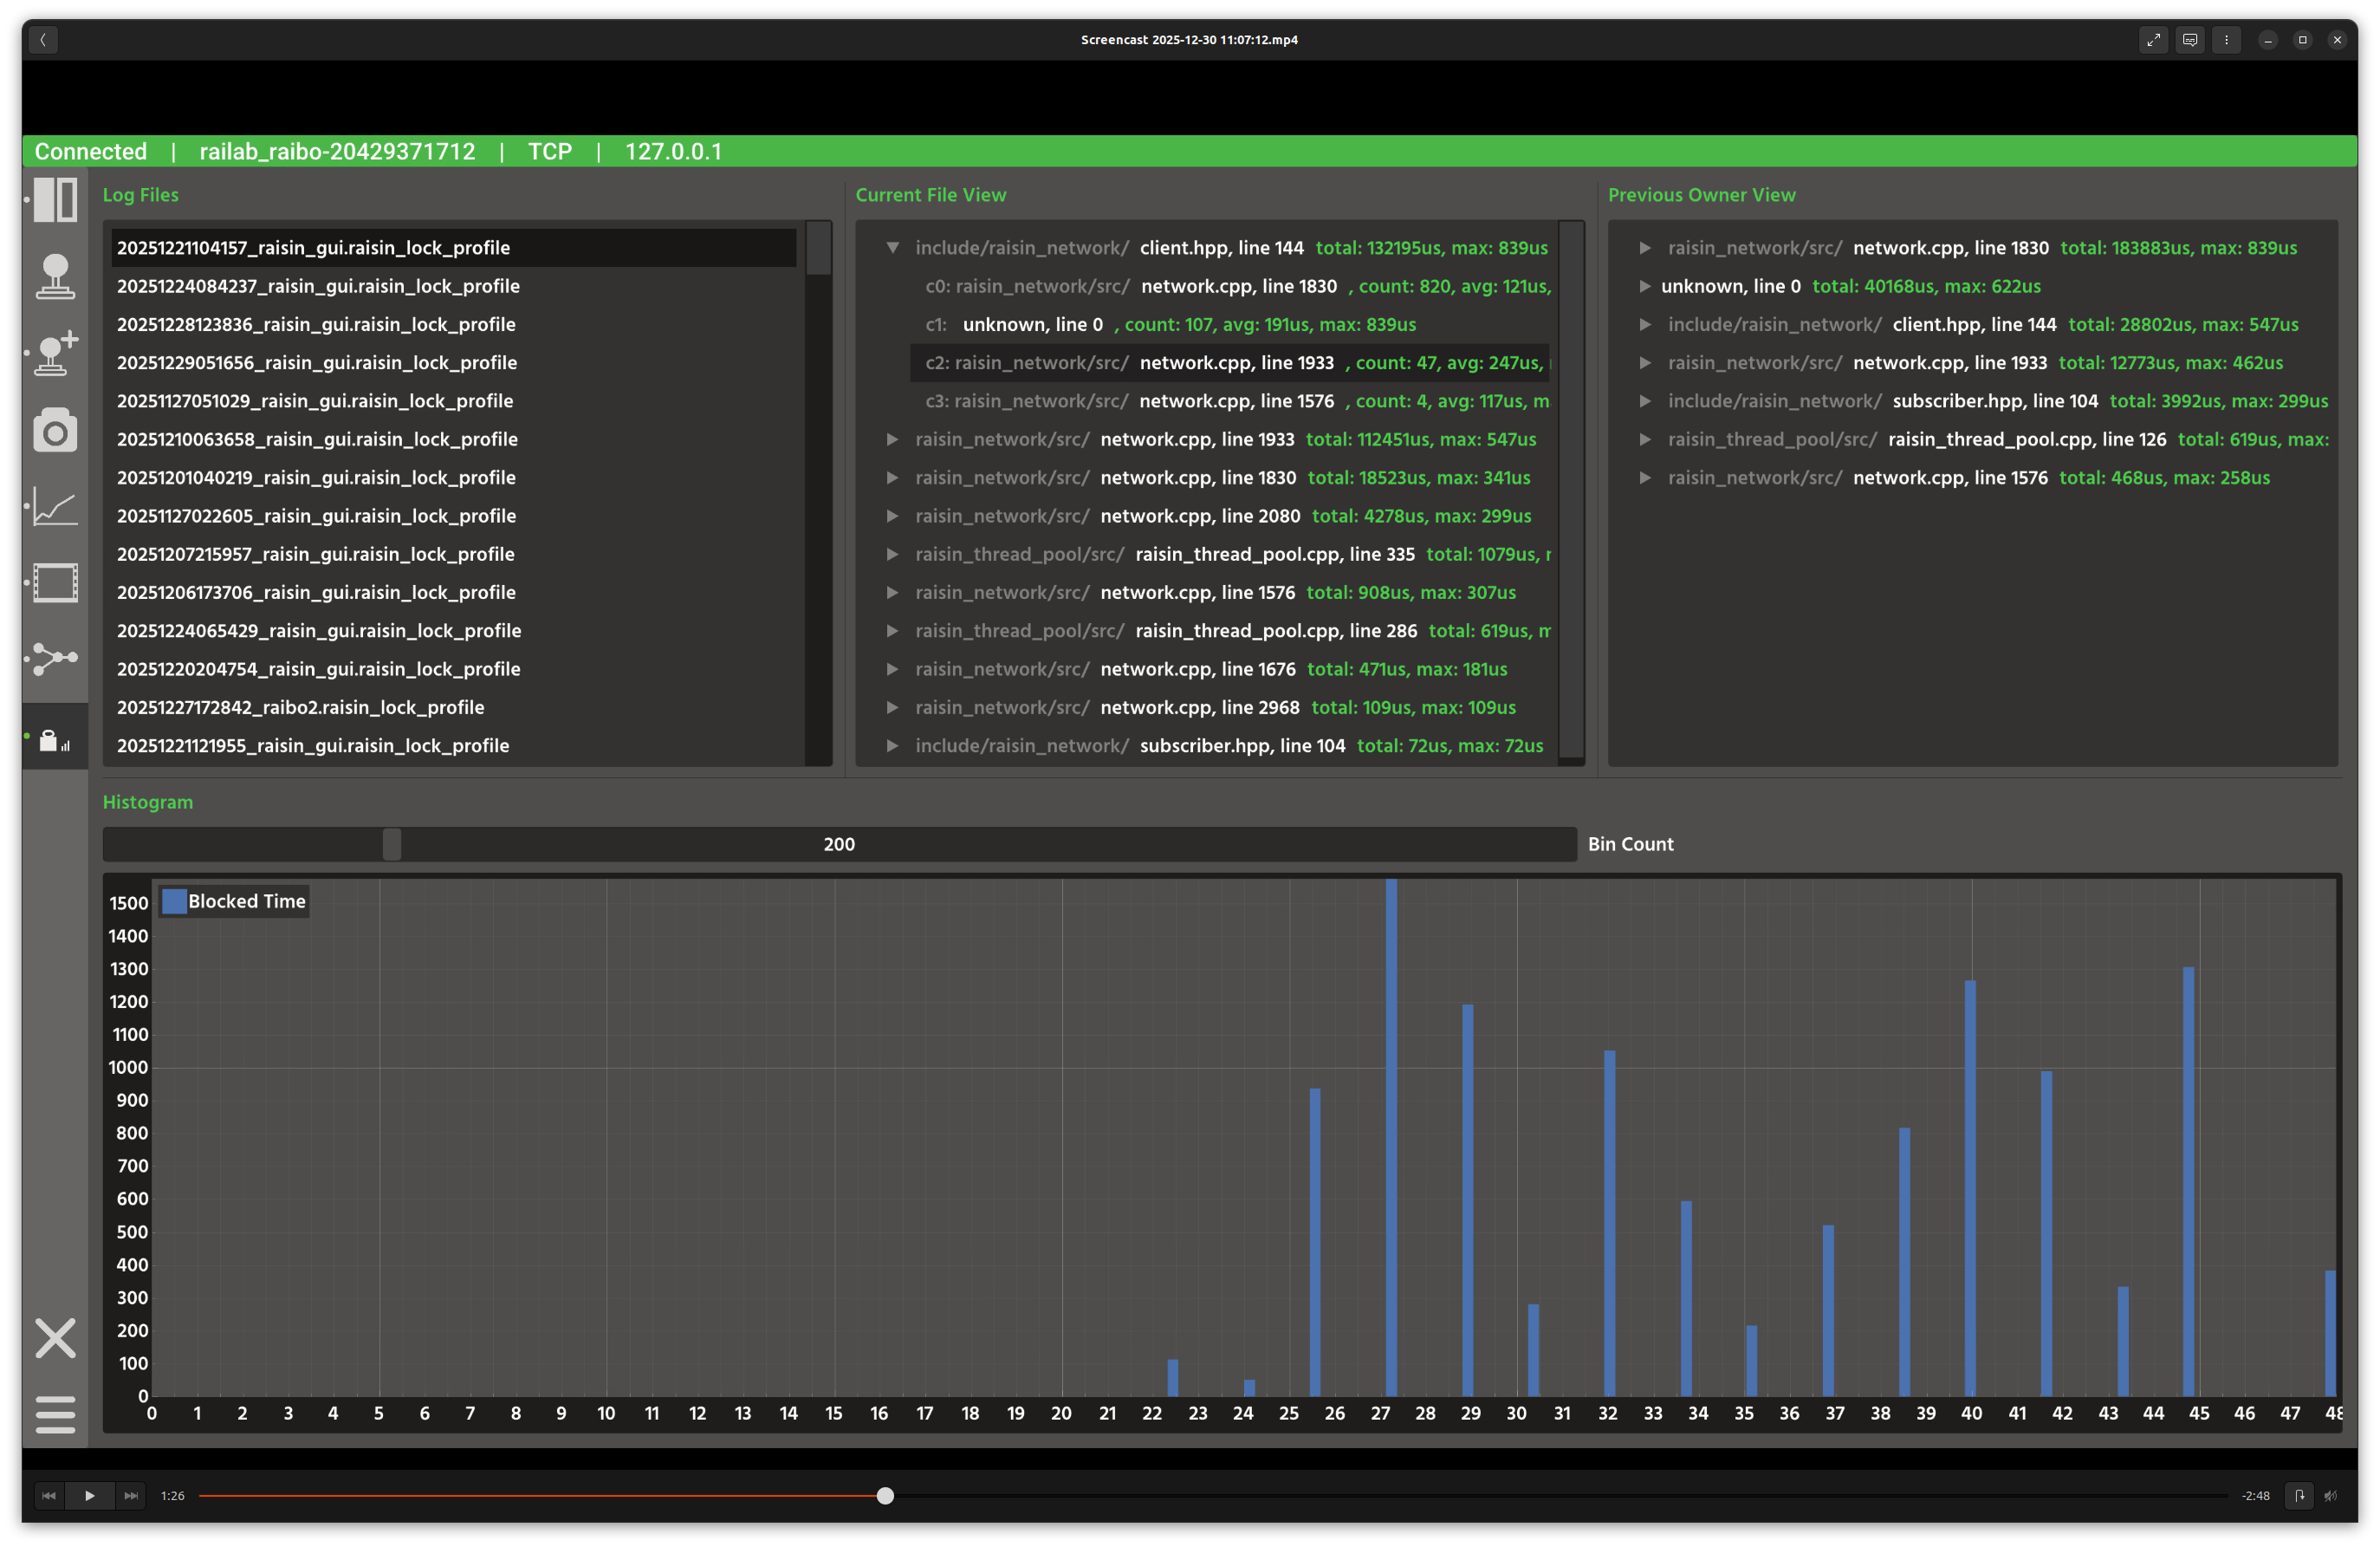
In the screenshot above, the top row compares lock wait statistics by current file and previous owner, while the bottom panel shows a histogram of wait-time bins for the selected lock pair.
Layout
Log files: list of
raisin_lock_profilerlogs.Current File View: aggregated wait times grouped by the current lock location.
Previous Owner View: aggregated wait times grouped by the previous holder of the lock.
Histogram: wait-time distribution for the selected lock pair.
Controls and Indicators
Selecting a log file parses the entries and populates the aggregates.
Selecting a row updates the histogram for that lock pair.
Bin Count slider changes histogram resolution.
Data Sources
Reads lock profiler logs from
raisin_lock_profileron disk.
Notes
Use the Current vs Previous views to distinguish where waits occur vs where locks are held too long.