Data Logger Window
Data logger window.
Overview
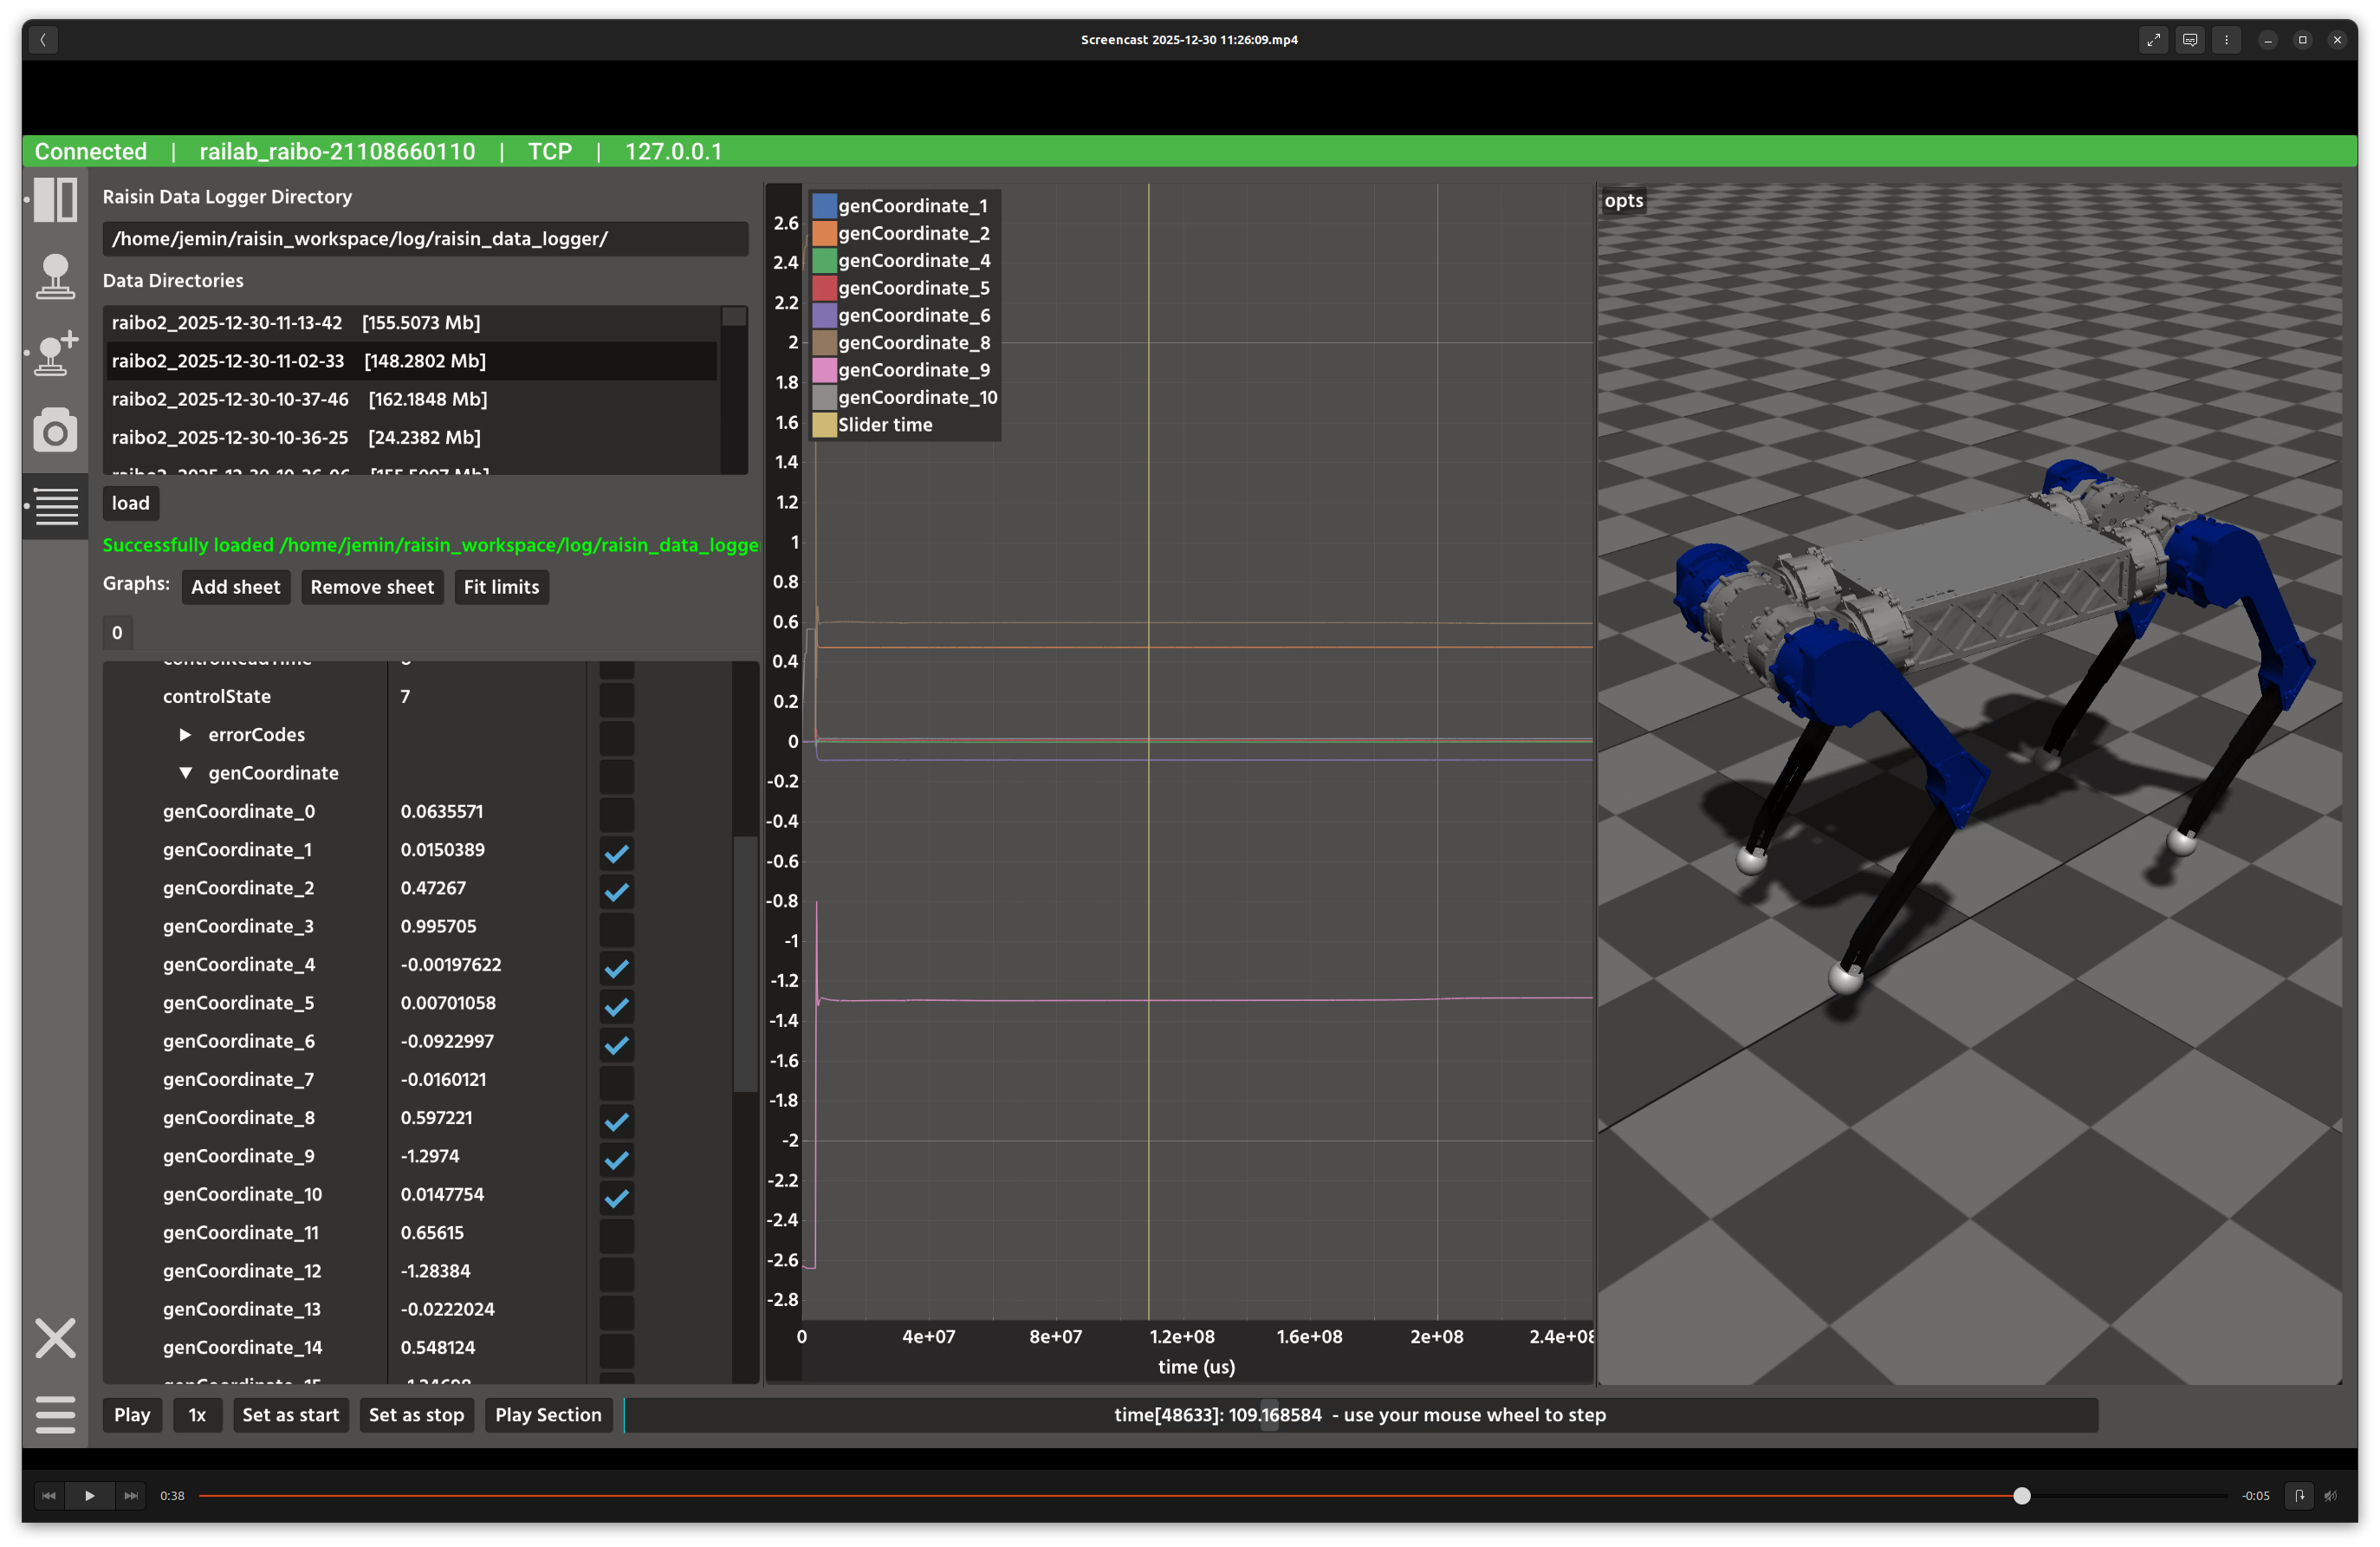
In the screenshot above, the left column selects and loads log sessions, the center column configures which fields to plot, and the right column renders both plots and a 3D replay view.
Layout
Log directory panel: choose the root directory and select a log session.
Load controls: load a session and show progress/status messages.
Plot selection: choose fields and divisions for each plot sheet.
Plot area: multiple synchronized plots with a shared time axis.
3D replay: Rayrai visualization of the robot state at the current time.
Time controls: play/stop, speed multiplier, and range selection.
Controls and Indicators
Add sheet / Remove sheet manages multiple plot tabs.
Fit limits auto-scales selected plots to the data range.
Play / Stop animates the time cursor over recorded data.
Set as start / stop defines a playback subsection.
Data Sources
Log data is read from
raisin_data_loggerdirectories containing.raisin_datafiles.The 3D replay uses the Raisim world definition corresponding to the device type encoded in the log directory name.
Notes
Large log files can take time to load; the progress bar indicates activity.
Use fewer plot divisions if rendering becomes sluggish on large datasets.